The Right Now section displays the overall statistics related to assets by content type, by workflow status, and by assignment (assigned user) in the form bar and pie charts.
To see the statistics for an asset type in the workspace:
- In the Content Type graph, select a content type graph bar.
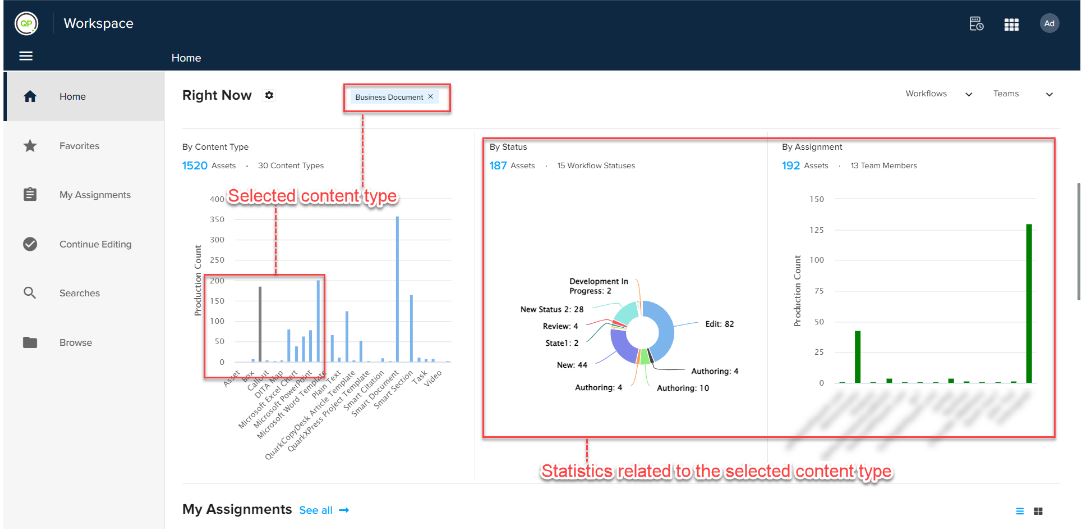
- The Workspace module adds a tag and highlights the graph bar for the selected content type and displays the related statistics in the Status pie chart and Assignment graph.

- If you want to switch back to display the statistics for all content types, select the cross sign against the tag that the Workspace module has added.
Priyanka Bhotika
Comments